Usage
The Dialogs
Export data: ‘Choose Path & Prefix’ Dialog
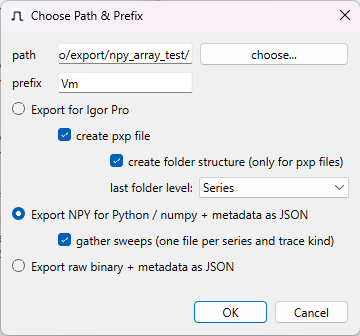
This dialog is displayed every time you are about to export traces.
General options
‘path’ If multiple files are exported, this is the path they will be saved to. Use button ‘choose…’ to call up a file dialog to choose the path (or enter a valid path manually).
‘prefix’ Exported waves will be prefixed with this text. If individual files are exported, they will have this prefix, too.
Selection of export method
All methods export additional metadata. See ‘Select Parameters’ Dialog for details on selection of parameters to be exported as metadata.
Note on multi-file exports from flatpaks
If you have installed PMbrowser as a flatpak, there is a caveat:
Due to restrictions imposed by flatpak’s sandbox, export methods that produce multiple files can only be used within the Documents folder (or subfolders thereof).
If you export to a single .pxp file, this restriction does not apply.
Export for Igor Pro
Checkbox ‘create pxp file’
All waves will be exported into a single packaged experiment file (
pxp). After clicking ‘OK’, a file dialog will show up that allows you to select a filename for the file to be created.Checkbox ‘create folder structure’
If you export as a
pxpfile, select this to create datafolders within thepxpfile that match the tree structure. You can choose if the grouping level for traces should be group or series.
Metadata will be included as wavenotes.
Export NPY for Python / numpy + metadata as JSON
Checkbox ‘gather sweeps’
If gather sweeps is not selected, each trace will be exported as a
.npyfile. Metadata for each trace will be export in JSON format (.json).If gather sweeps is selected, for each series that is about to be exported, all traces that are a (grand-)child of this series and that share the same trace ID will be gathered in a single
.npyfile as a 2D array. The first dimension of this array is the trace index, the second dimension the time (or x) dimension of the trace. This file will be accompanied by a JSON file containing the metadata for all sweeps/traces in the.npyfile.If for example a series has 10 sweeps that are to be exported and each sweep has a Vmon and an Imon trace, for this series two files will be created. One contains the 10 Vmon traces, the other contains the 10 Imon traces.
.npy files can be read via numpy.load(<filename>).
Demo python code showing how to use these files can be found in the Git repository
(folder demo).
Export raw binary + metadata as JSON
Each trace will be export as a .bin raw binary file. The data is exported as 64bit floating point.
Metadata for each trace, including samplerate, will be export in JSON format (.json).
‘Tree-Filter’ Dialog
This dialog allows you to hide nodes and traces of the data-tree that you are not interested in. It can be accessed from the Tree menu or via the Filter… button.
The filtering is based on perl style regular expressions. Only elements that match the given expression will remain visible, all other elements will be hidden.
The expression .* will match any name, therefore you can use it to display all nodes of a given category.
See section Selecting / Filtering Traces of Interest from the New User Tour for an example how to use this feature.
‘Select Parameters’ Dialog
For each of the four tree levels Group, Series, Sweep, and Trace you can select which parameters will be printed into the text area when a node is selected in the tree-view (checkbox ‘print’) and / or added to the wave-note of exported traces and exported as metadata tables (checkbox ‘export’, cf. section Notes on Exporting Data for IgorPro).
All paramters that might be of relevance should be available. If you miss something, please post a feature request on PMbrowser’s issues page.
Times can represented as relative times (Rel. time). The time reference for calculation of the relative times
can be set using the context menu of the tree-view. By default, the reference time is the start time of the
dat-file.
‘Setting and Ranges’ Dialog
Here you can configure the display area: axis ranges, autoscale on load, if grid lines should be displayed, if panning / dragging (see panning) should affect all Y scales or only the scale pertaining to the data unit of the currently selected trace, colors used for drawing traces and grid and the number of overlay traces to be kept in the internal display buffer.